🛠️ Workflow
This document outlines the step-by-step workflow used to project the extent of coastal flooding in Hong Kong in 2100.
Steps
A. 🔩 Data Preparation
- Download Land Utilization Raster Grid, and Hong Kong Digital Terrain Model from DATA.GOV.HK
- Restyle classification symbology for Land Utilization Raster Grid layer
- DTM dataset does not contain any coordinates
- Manual Georeferencing is required
B. 🗺️ Topographic Map
Run Contour (Spatial Analyst) to convert DTM layer into a topographic map
- As a Python Script:
import arcpy

# Setting workspace
arcpy.env.workspace = r"C:\Users\User\Documents\JonathanLeung_Winter2025\HK_DTM_5m_Full"
arcpy.env.overwriteOutput = True

# Contour Tool
HK_DTM = "Whole_HK_DTM_5m.asc"
outContour = r"C:\Users\User\Documents\JonathanLeung_Winter2025\HK_DTM_5m_Full\HK Processing\HK Processing.gdb\Contour_Whole_HKDTM"
arcpy.sa.Contour(HK_DTM,outContour,contour_interval=30,base_contour=0, z_factor=1,contour_type='CONTOUR')
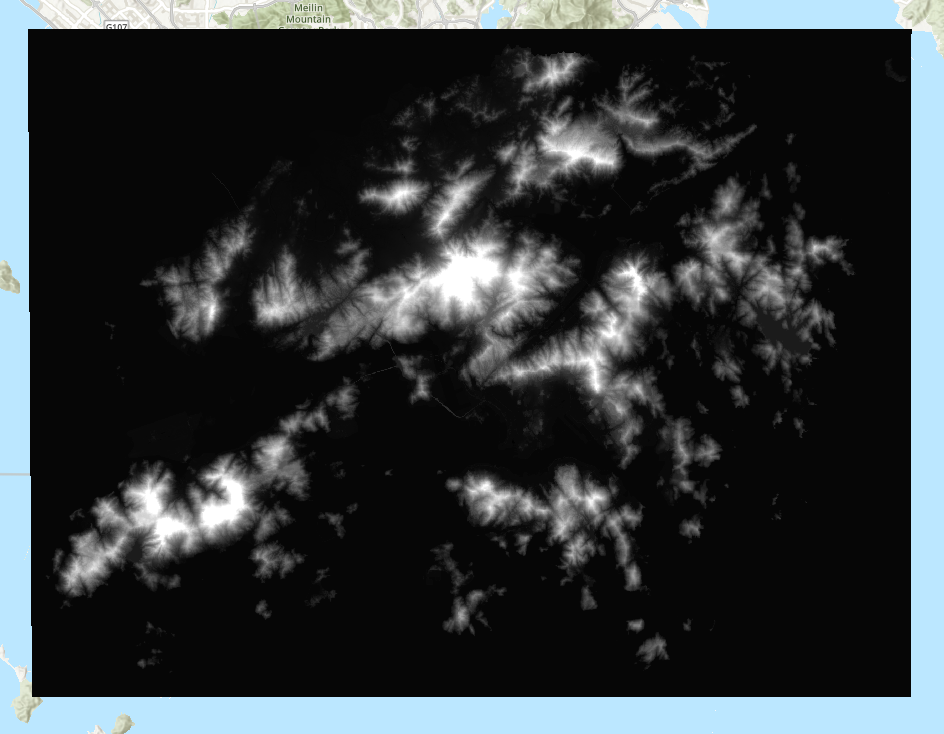
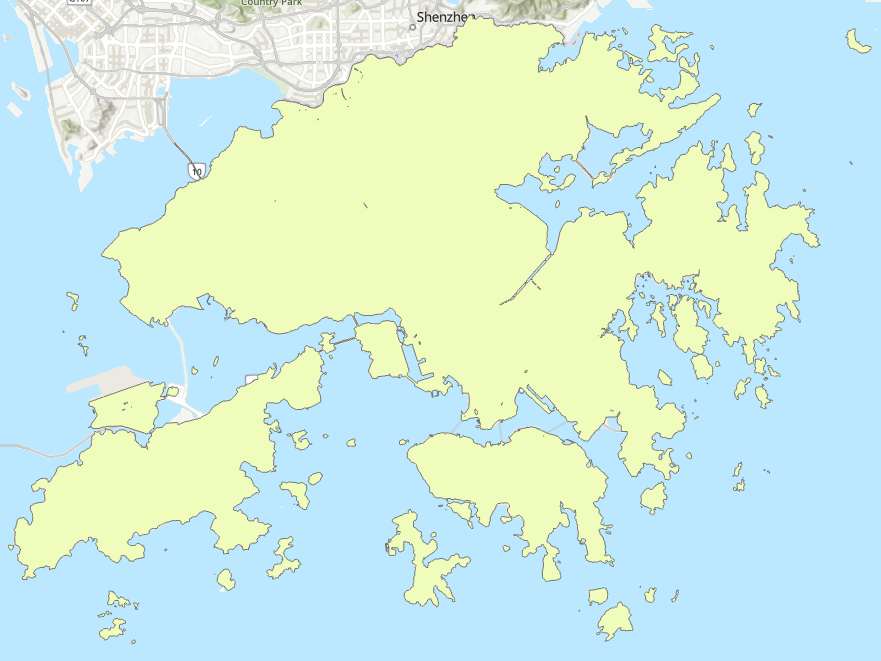
C. 📡 Digital Elevation Model
- Set boundary for Topo to Raster (Spatial Analyst)
- Generate a feature class of polygons covering the entire Hong Kong territory
- Run Topo to Raster (Spatial Analyst) to convert the topographic map to a DEM

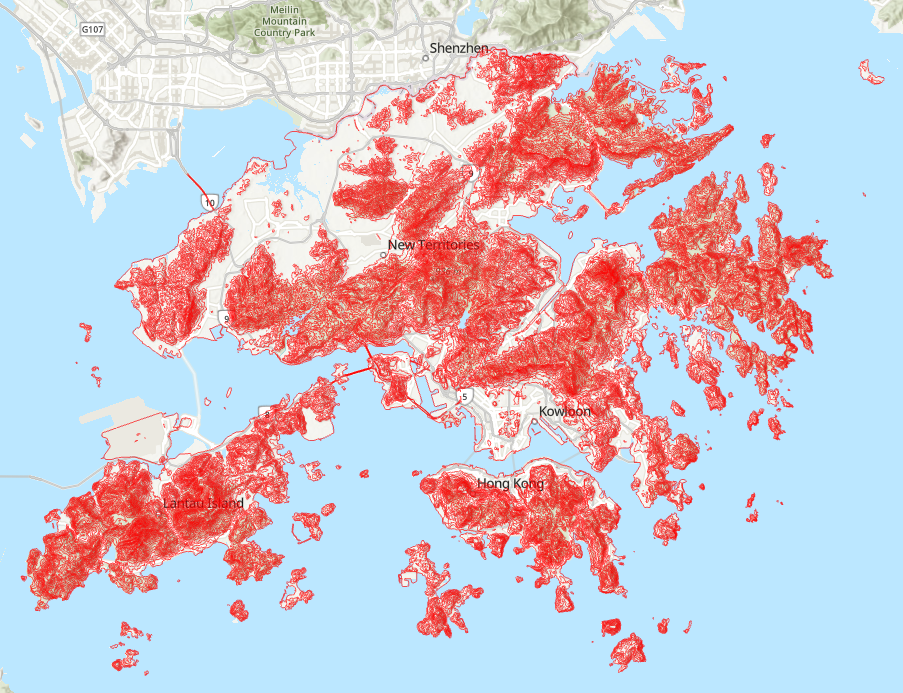
D. 💧 Flood Level Simulation
- Run Raster Calculator (Spatial Analyst) to generate binary raster layers that indicate areas that would be submerged under water or not. This project uses these figures for analysis:
| Emission Scenario | Median (m) | Algebra Expression |
|---|---|---|
| Very low | 0.38 | "HKDEM" <= 0.38 |
| Intermediate | 0.56 | "HKDEM" <= 0.56 |
| Very High | 0.78 | "HKDEM" <= 0.78 |
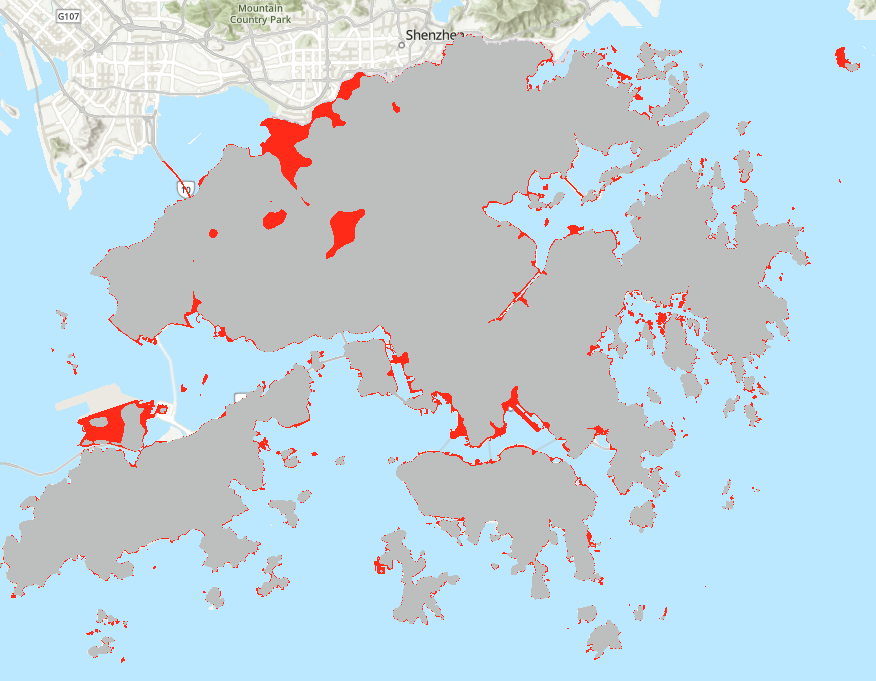
Red indicates flooded areas Grey indicates non-flooded areas
- Delete the grey label in the symbology tab for better visualization
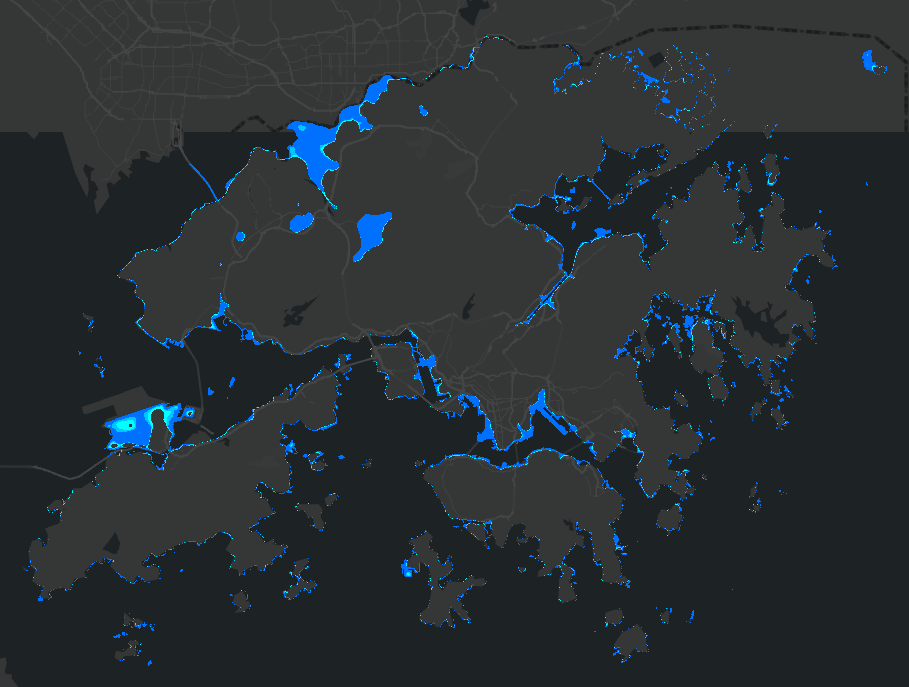
E. 🔣 Symbology
- Main Map
- Apply OpenStreetMap Dark Gray Canvas Base (WGS84) as basemap
- Overlay flood binary raster layers on top of each other
- Style all binary raster layers in different shades of blue or cyan
- Inset Maps: highlight 3 specific areas to showcase impact
- Overlay the intermediate emission scenario flood binary raster layer on Land Utilization Raster Grid
- Apply transparency and layer blend to show what land use would be affected by coastal flooding
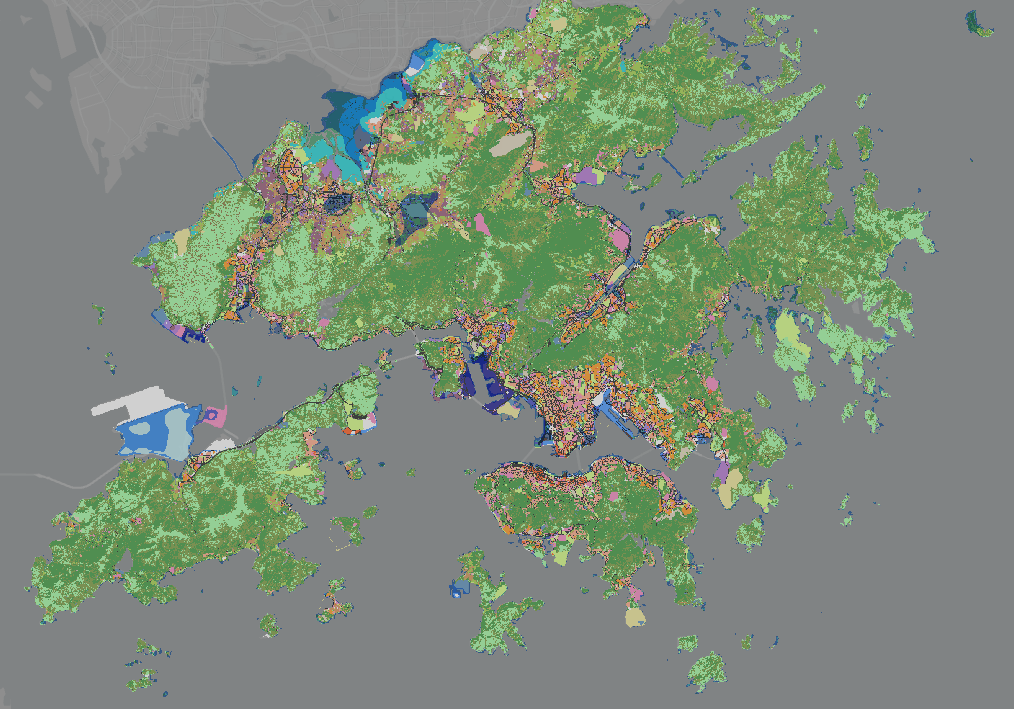
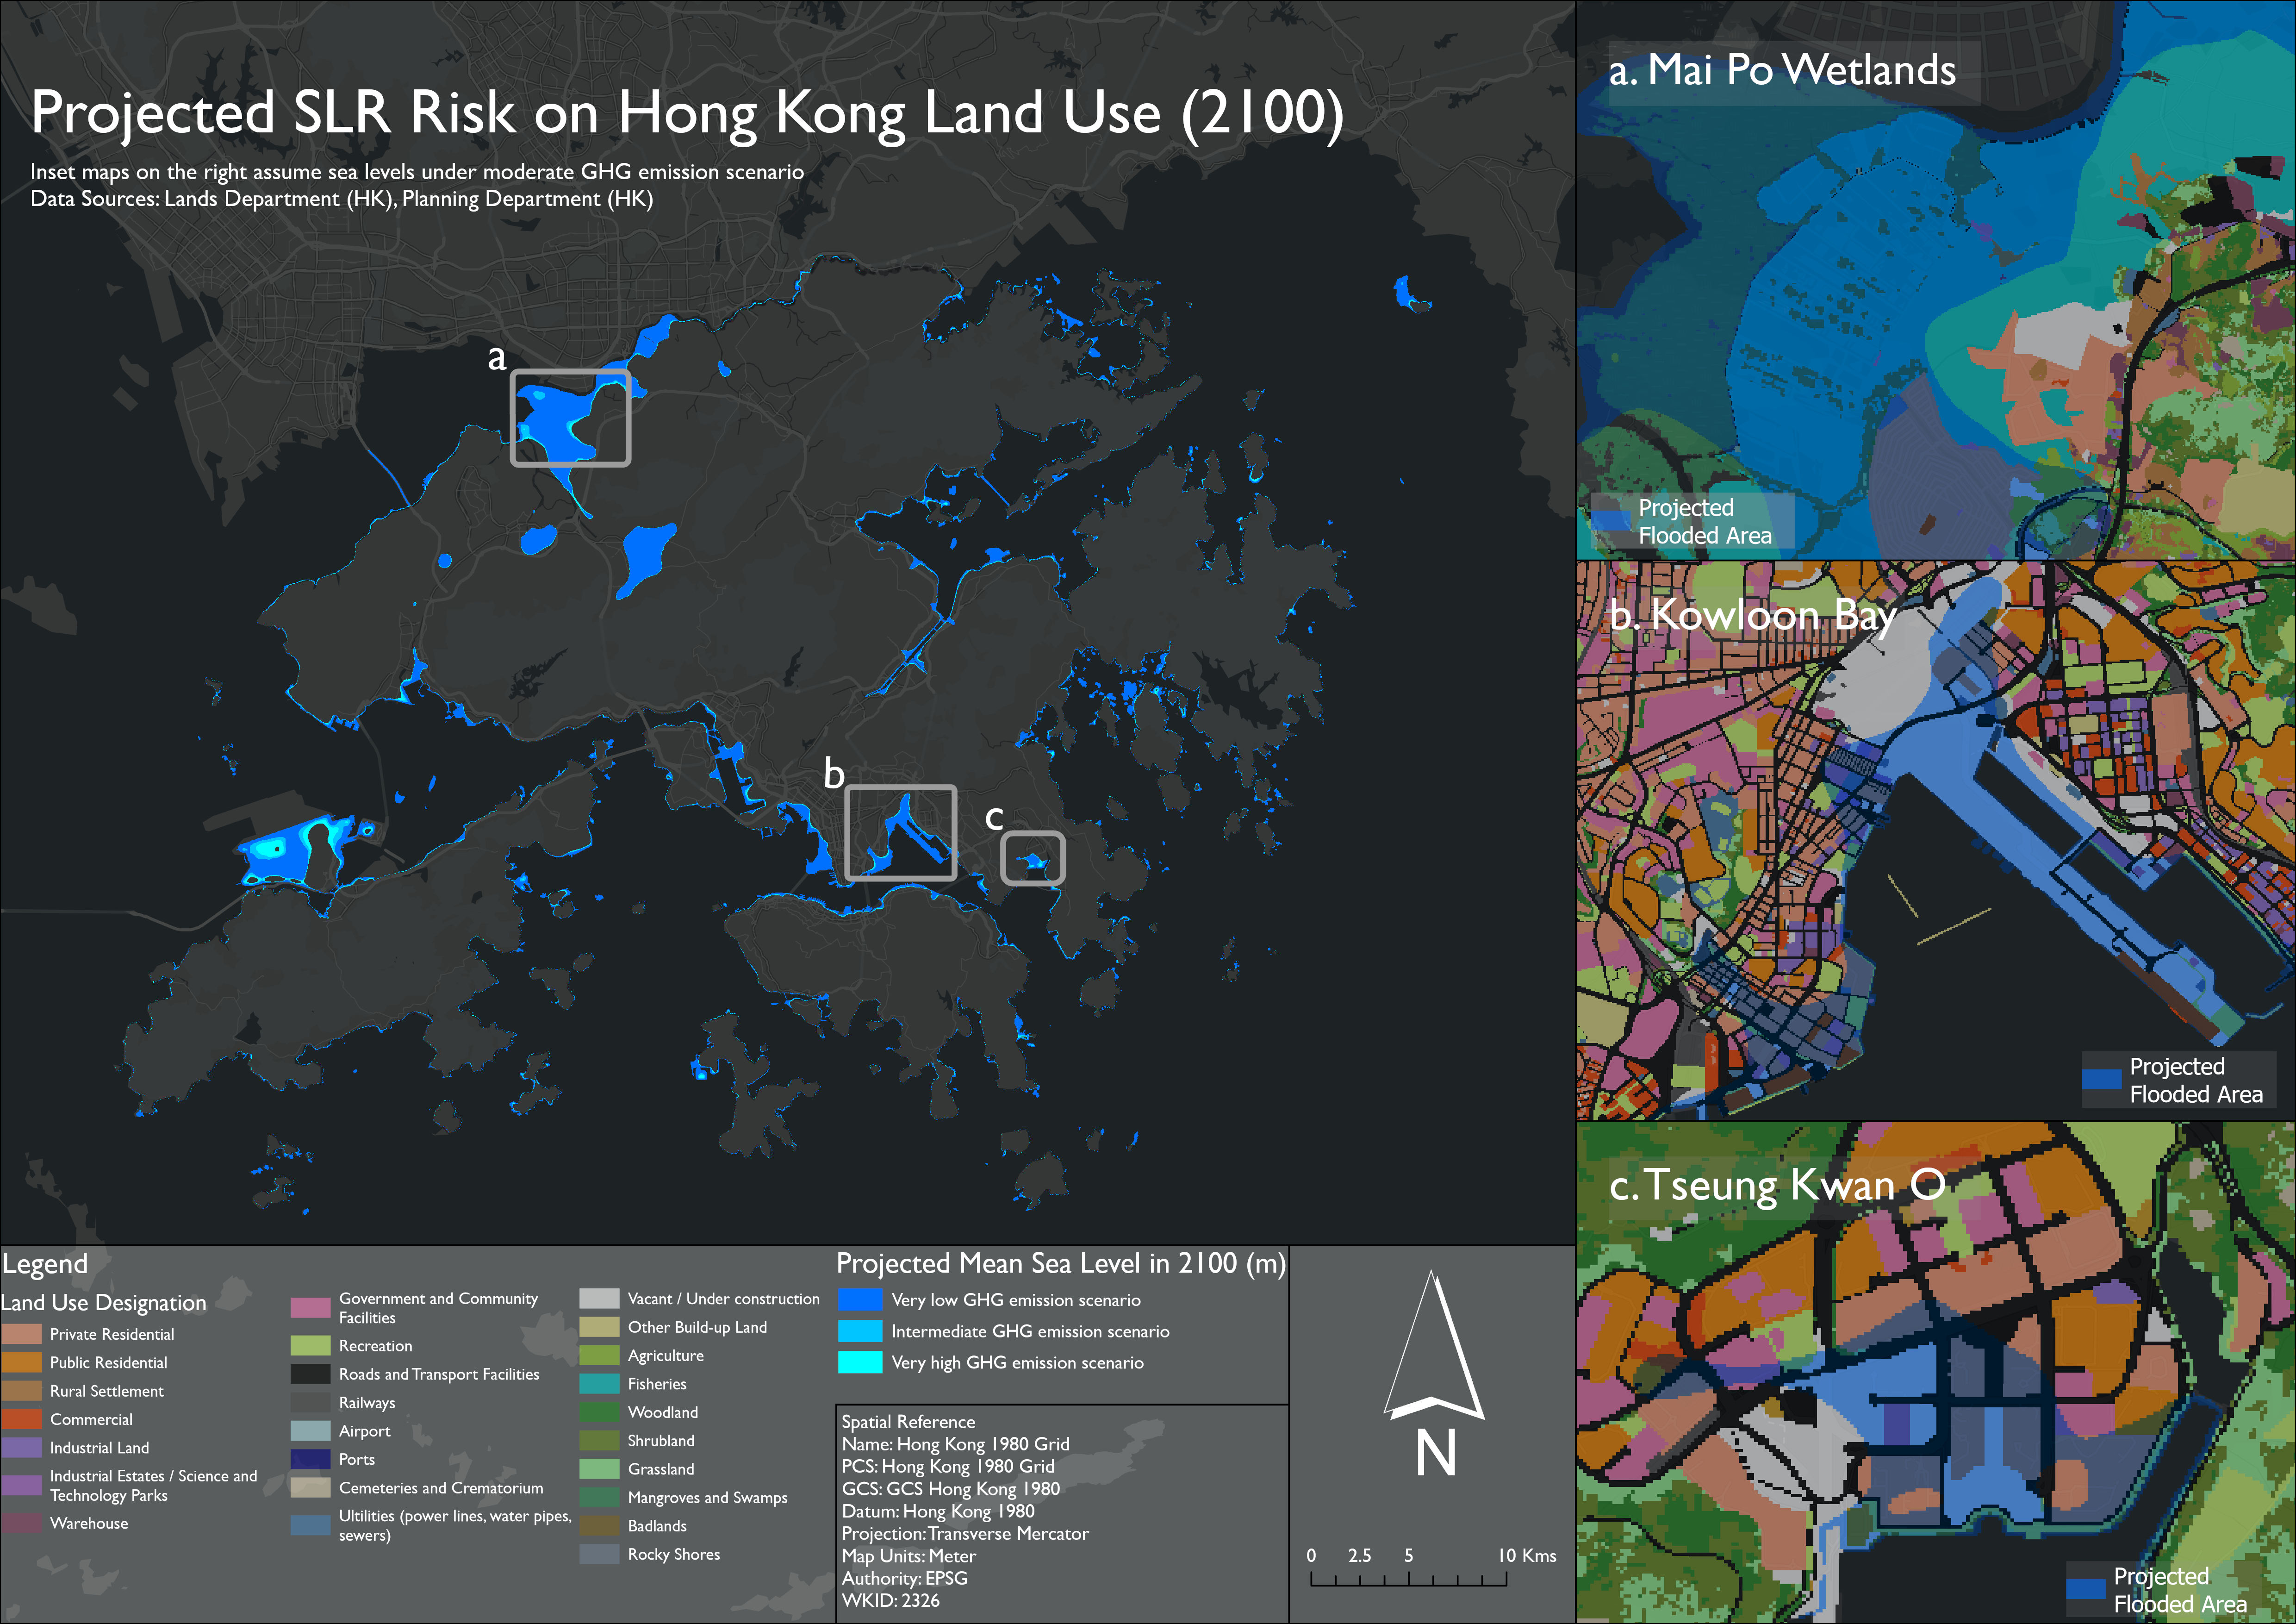
Final Product